 comparison
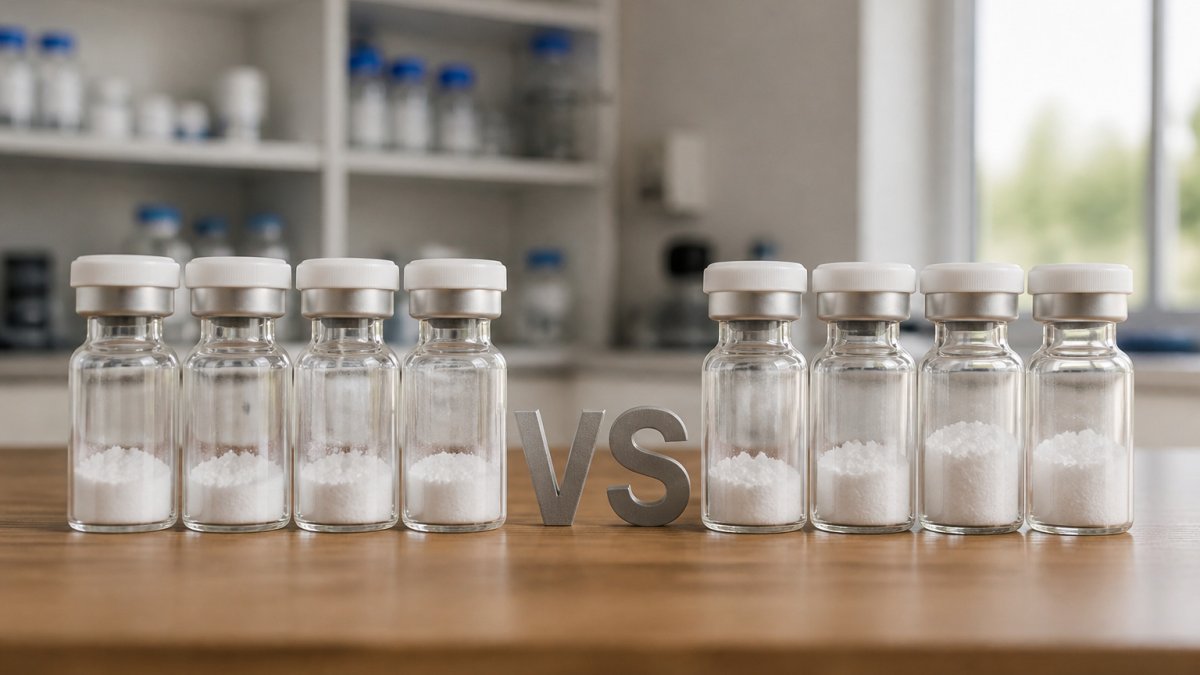
Is 95% Peptide Purity Enough for Research?
Last Updated: October 27, 2026
Quick Summary
Whether 95% peptide purity is enough depends on what the number was measured against, how it was measured, and what your assay can tolerate. Qualitative screening and method development usually tolerate 95%, but receptor binding, low-dose cell work, and structural studies typically need 98% or higher.
- A 95% purity figure is a peak area percentage, not a statement of mass composition.
- Peptide content is reported separately and should be requested before quantitative experiments.
- Co-eluting impurities merge into the main peak and can inflate the reported percentage.
- The residual 5% can include truncated peptides, deletion sequences, oxidized species, and diastereomers.
- Confirm the COA includes the chromatogram, mass spectrometry result, and HPLC method details.
Table of Contents
- What 95% Peptide Purity Actually Means on a COA
- Peptide Purity vs. Peptide Content: The Distinction That Changes Your Calculations
- Peptide HPLC Purity Testing: How the Number Is Generated
- What the Remaining 5% Can Contain
- How to Read a Peptide COA Before You Accept a Batch
- When 98% Peptide Purity Is the Better Choice
- Matching Purity to Your Research Application
- Ordering Peptides With Documentation You Can Defend
- Frequently Asked Questions
What 95% Peptide Purity Actually Means on a COA
A 95% purity figure on a certificate of analysis means the main peak accounts for 95% of total peak area in the chromatogram. For the broader framework behind that figure, see our guide to research grade peptide purity standards. It does not mean 95% of the powder is your target peptide, and it does not tell you what the other 5% is.
Whether 95% peptide purity is enough depends on what the number was measured against, how it was measured, and what your assay can tolerate. A 95% area percentage from a clean reverse-phase separation is a different product from a 95% figure from a poorly resolving column.
Peak area percentage is the share of total detector signal attributed to the main peak. Everything the detector saw, including truncated peptides, deletion sequences, and oxidation products, gets counted in the denominator.
Peak Area Percentage and What It Counts
Divide the main peak's area by the sum of all integrated peak areas, then multiply by 100. What matters is what got integrated: small shoulders below the threshold disappear from the math, and salts, counterions, and residual water typically do not register at the peptide detection wavelength.
The percentage describes the separation, not the sample.
Peptide Purity vs. Peptide Content: The Distinction That Changes Your Calculations
Peptide purity and peptide content are different measurements. Purity describes the proportion of peptide material that is the target sequence. Content describes how much of the vial's mass is peptide at all, versus salts, water, and counterions.
Peptide content is usually reported separately, often by nitrogen analysis or UV absorbance against a standard curve. Many certificates report purity alone. When content is missing, ask for it, or run your own determination before setting up a quantitative experiment.
Peptide HPLC Purity Testing: How the Number Is Generated
Peptide HPLC purity testing separates the sample on a reverse-phase column and quantifies what elutes.
The software integrates the resulting peaks and reports area percentage.
Detector Response and the Limits of Area Percentage
Not every peptide absorbs identically at a given wavelength. A trace impurity with strong absorbance can look larger than its actual mass fraction, and a poorly absorbing impurity can hide.
Co-elution is the bigger problem: an impurity sharing a retention time with your target merges into the main peak and inflates the number. A 95% result from a method that cannot resolve closely related sequences is not comparable to one from a well-developed gradient, which is why column type, gradient, and wavelength belong on the certificate.
If you want to see how to read the underlying chromatogram and calculate purity yourself, our guide on understanding HPLC chromatograms for research peptides walks through the integration step by step.
What the Remaining 5% Can Contain
The residual 5% is not a single substance. It is a mixture, and its composition matters more than its size. Common constituents include:
- Truncated peptides from incomplete coupling during synthesis
- Deletion sequences missing one or more residues
- Oxidized species, particularly where methionine or cysteine is present
- Diastereomers from racemization at coupling steps
- Residual solvents and salts from purification and lyophilization
For a deeper look at how these impurities arise and how to detect them, see our breakdown of common peptide impurities in research.
How to Read a Peptide COA Before You Accept a Batch
A certificate of analysis can include information about the method behind the number. Read it in this order: identity confirmation, purity method, content, then batch identification.
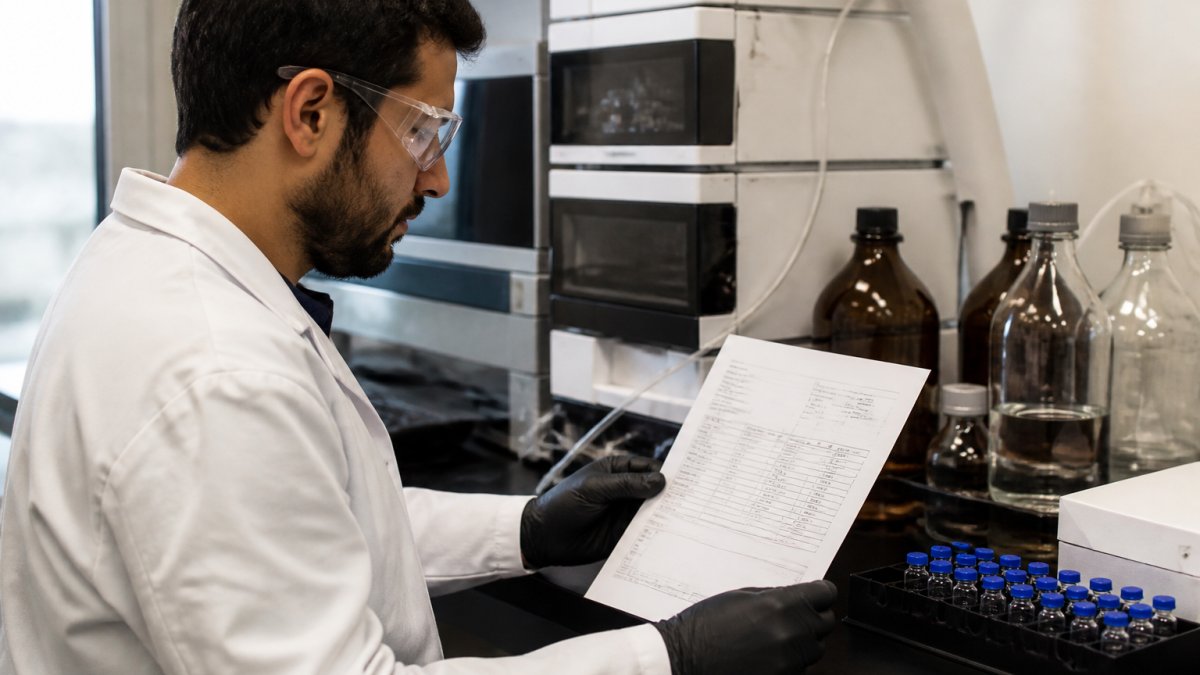
How to read a peptide COA comes down to a short checklist:
- Batch or lot number that matches the vial label
- Mass spectrometry result confirming the expected molecular weight
- HPLC method details: column, gradient, wavelength, run time
- Purity percentage with the chromatogram attached, not just a figure
- Peptide content or net peptide statement
- Appearance and solubility notes
- Testing laboratory identified, with a date
Our overview of certificate of analysis documentation explains why each field exists and what a complete package looks like.
When 98% Peptide Purity Is the Better Choice
At 95% purity, 5% of the peptide mass is something other than your target sequence; at 98% that fraction shrinks by more than half. Whether that matters depends on what the residual fraction contains and how your readout responds.
How the Residual Fraction Interferes
In cell-based work at low dose, the concern is off-target signaling. A minor byproduct can trigger a pathway your target peptide does not, and the effect will be attributed to the target. In structural work, impurity peaks complicate spectral interpretation and can be misassigned as real features of the target.
What the Remaining 2% Can Still Contain
A 98% figure does not mean the sample is free of related substances. The remaining 2% can include truncated sequences, oxidized species, diastereomers, residual salts and counterions, and residual water. Ask for the impurity profile, not just the percentage.
Where 95% Holds Up Fine
Qualitative work, initial screening, method development, and applications detecting a strong signal rather than measuring a subtle one are contexts where 95% is commonly adequate. The 98% premium reflects additional chromatography passes; whether it pays off depends on what a failed experiment costs you.
Acceptance Criteria for a 98% Lot
Before accepting a high-purity lot, confirm the COA includes the chromatogram, mass spectrometry result, HPLC method details, testing laboratory name, and test date. If the chromatogram shows poor resolution or integration that excludes visible shoulders, request a rerun or reject the lot.
For a deeper look at how impurities arise and how to detect them, see our breakdown of common peptide impurities in research.
Matching Purity to Your Research Application
Is 95% peptide purity enough for research? The answer is conditional. The threshold depends on three variables: how sensitive your readout is, how low your working concentration is, and how much a false positive or false negative costs you. The framework below treats purity as one input among several, not a pass/fail number.
A Direct, Conditional Answer by Experiment Type
| Research context | Is 95% typically adequate? | Why | What to verify before accepting the lot |
|---|---|---|---|
| Qualitative screening, pilot studies, method development | Usually yes | Strong signals and generous working concentrations tolerate a minor impurity fraction | Chromatogram attached; identity confirmed by mass spectrometry |
| Routine quantitative assays (ELISA, colorimetric) | Conditional, 95% may suffice if content is known and the standard curve is matrix-matched | Impurity response can skew absorbance or fluorescence if the impurity co-elutes with your analyte | Peptide content stated; impurity profile reviewed; standard curve run with the same lot |
| Receptor binding and competition assays | Usually no, 98% or higher | A truncated or deletion analog at 5% of a high total concentration can act as a competing ligand and shift the curve | Mass spec identity; chromatogram resolution; independent testing laboratory named |
| Cell-based work at low dose | Usually no, 98% or higher | Trace byproducts can trigger off-target signaling at concentrations where the target peptide is only weakly active | Endotoxin statement if applicable; impurity profile; lot-specific COA |
| Structural characterization (NMR, CD, crystallography) | Usually no, 98% or higher | Impurity peaks complicate spectral interpretation and can be misassigned | Full analytical package; orthogonal identity data |
| In vivo or formulation work | Depends on route and dose; often 98% or higher | Minor contaminants scale with dose and can drive tolerability or formulation issues | Content, counterion identity, residual solvent data |
What the Percentage Does Not Tell You
A purity figure is a chromatographic area percentage, not a statement of mass composition. It does not establish identity, concentration, counterion content, water content, or residual solvent levels. Before treating 95% as sufficient, confirm the certificate reports peptide content separately and the chromatogram shows baseline resolution.
Practical Acceptance and Retesting Criteria
Use a short checklist before accepting any lot, regardless of the stated percentage:
- Lot number on the vial matches the COA
- Mass spectrometry result confirms the expected molecular weight
- HPLC method details are stated: column, gradient, wavelength, run time
- Chromatogram is attached, not just a percentage
- Peptide content or net peptide statement is present
- Testing laboratory is identified, with a test date
- COA date is recent relative to the shipment
Method Limitations That Change the Number
HPLC purity depends on method, detector response, integration parameters, and sample preparation. A single percentage does not establish identity or concentration.
For a fuller cost-benefit breakdown of purity tiers, read whether high purity peptide synthesis is worth the extra cost.
Ordering Peptides With Documentation You Can Defend
Documentation supports transparent reporting of how material was characterized.
At Globo Research Peptides, we provide full Certificate of Analysis documentation for every batch and verified ≥99% HPLC purity through third-party testing. Our special-order program supports requests for unique products, and in-stock inventory is ready for immediate dispatch.
The real question is not whether 95% is enough in the abstract, but whether you can prove what is in your vial when it counts. Get started with Globo Research Peptides.
Frequently Asked Questions
Is 95% purity good for peptides?
A 95% peptide purity figure describes the main peak in an HPLC chromatogram, not the mass of peptide in the vial. Match the threshold to what your assay can tolerate.
Is 98% purity better than 95% for peptides?
A 98% peptide purity result leaves roughly half as much non-target material as a 95% result. It is not automatically better for every study. The decision should follow your assay's tolerance for impurities, not the highest number on a price list.
Does peptide purity indicate the amount of peptide in a vial?
No. Purity is an area percentage from chromatographic separation, so it tells you the proportion of the main peak relative to other detected peaks. Peptide content is a separate measurement of how much actual peptide mass the sample contains, accounting for counterions, water, and residual solvents.
How is peptide purity measured by HPLC?
Reverse-phase high-performance liquid chromatography separates the sample across a column, and a UV detector records each component as it elutes. The software integrates the resulting peaks and reports the main peak as a percentage of total peak area.
Purity claims are easy to print and hard to verify. Before your next batch arrives, decide what documentation you will accept and what you will send back. Globo Research Peptides supplies verified ≥99% HPLC purity, full COA documentation for every batch, and third-party testing results you can attach to your records. Order now and give your study the paper trail it deserves.