 ultimate-guide
Understanding HPLC Chromatograms for Research Peptides
Table of Contents
- What Is HPLC and Why It Matters for Peptide Research
- How to Read HPLC Chromatograms for Research Peptides
- How to Calculate Peptide Purity from HPLC
- Common Peptide Impurities in HPLC
- HPLC vs LC-MS for Peptide Analysis
- Factors That Affect Chromatogram Results
- Conclusion
- Frequently Asked Questions
Last Updated: September 10, 2026
What Is HPLC and Why It Matters for Peptide Research
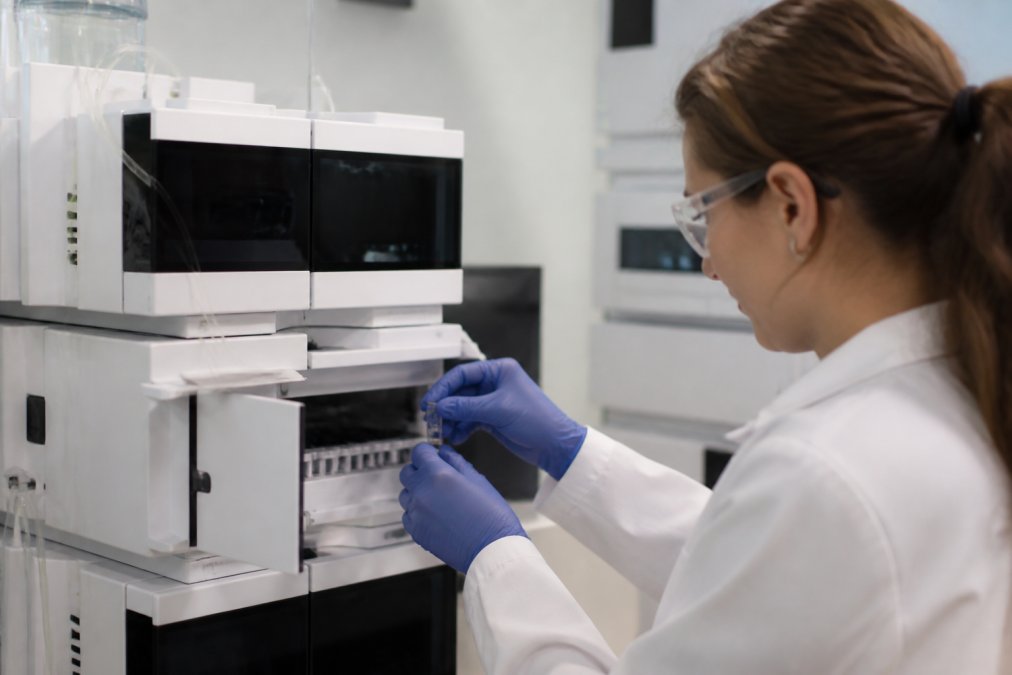
High-performance liquid chromatography, or HPLC, is an analytical technique that separates the components of a dissolved sample by passing it through a packed column under pressure and measuring what elutes at each point in time. For peptide researchers, it answers the question that matters most: how pure is this compound?
At Globo Research Peptides, we provide a full Certificate of Analysis documentation for every batch, which includes verified purity of ≥99% HPLC purity. We believe that transparent documentation is essential for research. The separation itself works through two phases: a stationary phase (the column packing) and a mobile phase (the solvent system pumped through it). Peptides partition between the two based on hydrophobicity, and the detector records their exit as peaks.
FDA guidance on analytical procedures and methods validation
How to Read HPLC Chromatograms for Research Peptides
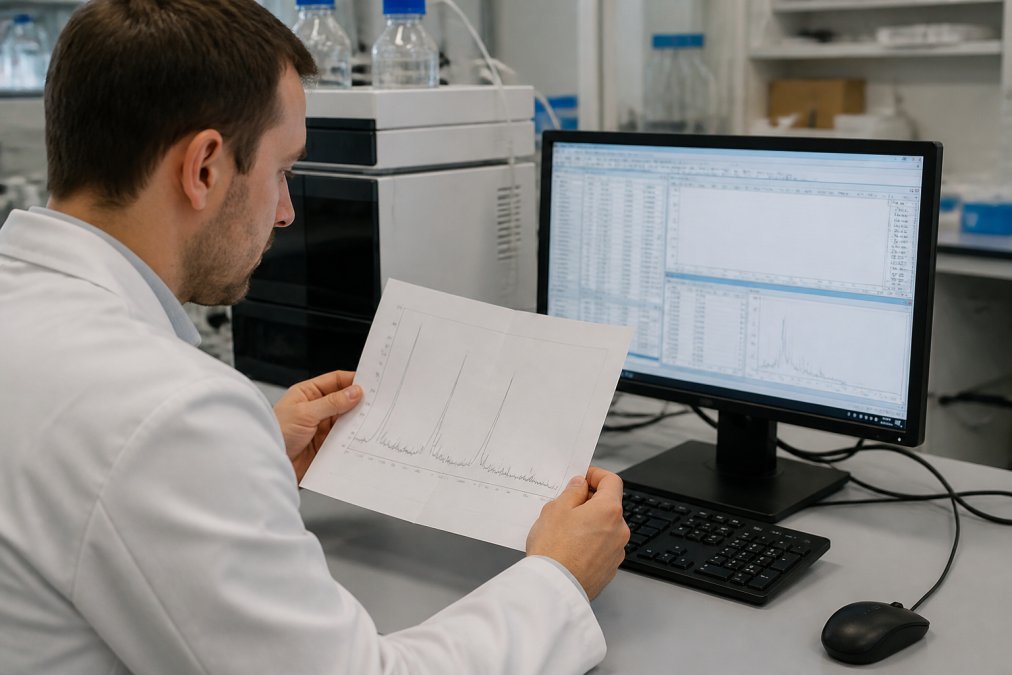
Learning to read HPLC chromatograms for research peptides means identifying which peaks represent your target compound and which represent everything else. The largest, sharpest peak is usually the main peptide; smaller peaks around it are impurities, counterions, or degradation products.
Identifying the Main Peptide Peak vs. Solvent Artifacts
The main peptide peak elutes at a retention time consistent with the method's reference standard. Solvent artifacts, by contrast, often appear as a sharp spike near the void volume at the very start of the run, before the column has had time to separate anything. A common mistake is counting that injection front as an impurity. It is not part of the sample; it is the solvent.
Understanding Retention Time and Peak Tailing
Retention time is the elapsed time between injection and the peak's maximum height. It is your primary identification tool, but it is method-dependent: change the gradient, column chemistry, or flow rate and the same peptide will elute at a different time. Peak tailing, where the right side of a peak stretches out asymmetrically, usually signals secondary interactions with the stationary phase or column degradation.
| Observation | Likely Cause | Practical Fix |
|---|---|---|
| Spike at start of run | Solvent/injection artifact | Exclude from integration |
| Broad, asymmetric peak | Column aging or overload | Reduce load, replace column |
| Shifted retention time | Gradient or temperature drift | Re-equilibrate, control temp |
| Extra late peaks | Degradation or synthesis byproducts | Re-run with fresh sample |
How to Calculate Peptide Purity from HPLC
Peptide purity from HPLC is calculated as area percentage: the area of the main peak divided by the total area of all integrated peaks, multiplied by 100. This is why integration parameters matter so much. Software decides where each peak begins and ends, and those decisions change the denominator.
Area Percentage and Peak Integration Parameters
Most analysts use a threshold-based integration method, where the software only counts peaks above a set height or area cutoff. Set the threshold too high and you hide real impurities; set it too low and you integrate baseline noise as if it were sample. What most guides miss is that two labs can run the same sample and report different purity numbers purely because of integration settings. Always ask for the method parameters alongside the result.
Common Peptide Impurities in HPLC
The impurities that show up in peptide chromatograms fall into predictable categories, and each one leaves a recognizable signature in the trace. Learning those signatures is what turns a chromatogram from a purity number into a diagnostic tool.
Deletion and Truncation Sequences
Solid-phase peptide synthesis adds one residue at a time, and each coupling step has a finite efficiency. When a coupling fails, the chain continues growing without that residue, producing a deletion sequence that is one amino acid short. Because a single residue changes the peptide's hydrophobicity only slightly, deletion sequences typically elute very close to the main peak, often as a shoulder or a partially resolved neighbor. This is the single most common reason a main peak looks asymmetric on its leading edge rather than its trailing edge.
Truncated fragments, chains that stopped growing early, are usually more polar than the full-length peptide and elute earlier, sometimes clustering near the void volume where they can be mistaken for solvent artifacts.
Oxidation Products
Methionine, cysteine, and tryptophan residues are susceptible to oxidation during synthesis, purification, or storage (PubMed). An oxidized peptide is more polar than its reduced form, so the oxidized species typically elutes slightly earlier than the parent, appearing as a leading shoulder or a distinct pre-peak. A pattern of increasing pre-peak area across a stability study is a classic oxidation signature.
Counterions and Residual Solvents
Trifluoroacetate (TFA) is the standard ion-pairing reagent in peptide purification, and residual TFA or acetate counterions can appear as small, poorly retained peaks near the solvent front (PubMed). These are not peptide-related impurities, but they still contribute to the total integrated area if the integration threshold is set low enough to capture them.
Diastereomers and Racemization
Racemization at a stereocenter produces a diastereomer with nearly identical mass but different hydrophobicity. These often co-elute with the main peak under standard gradients and only resolve under a shallower gradient or a different column chemistry, a key reason two labs can report different purity for the same lot.
Diagnostic Quick Reference
| Impurity Class | Typical Elution Position | Peak Shape Signal |
|---|---|---|
| Deletion sequence | Near main peak | Leading shoulder or split |
| Truncated fragment | Early, near void volume | Small early peaks |
| Oxidation product | Slightly before main peak | Pre-peak or leading shoulder |
| Counterion / solvent | At or near void volume | Sharp, poorly retained spike |
| Diastereomer | Co-eluting with main peak | Broadened main peak |
Why Resolution Determines What You Can See
Resolution between the main peak and its nearest neighbor sets the ceiling on detectable purity. If two species co-elute, the software integrates them as one peak and the reported purity is artificially high. This is why a method with poor resolution can report 99% purity for a sample that a higher-resolution method would report as 92%. The chromatogram is only as honest as the separation behind it.
HPLC vs LC-MS for Peptide Analysis
HPLC tells you how much of your sample is one thing versus everything else. LC-MS tells you what each of those things actually is. That distinction decides which tool you need.
| Criterion | HPLC | LC-MS |
|---|---|---|
| Primary output | Purity (area %) | Identity and mass |
| Detects impurities | Yes, by peak area | Yes, with molecular weight |
| Confirms sequence | No | Yes, via fragmentation |
| Typical use | Routine QC release | Structural confirmation |
| Cost and complexity | Lower | Higher |
For routine quality control, HPLC alone is often sufficient. For novel compounds or disputed results, LC-MS is the tiebreaker. The strongest documentation pairs both.
Factors That Affect Chromatogram Results
Small changes in method conditions move peaks in ways that catch people off guard. A chromatogram is not a property of the peptide, it is a property of the peptide plus the exact method that produced it. Understanding which variables matter, and how, is what lets you compare results across labs without being misled.
Gradient Slope and Run Time
Reversed-phase peptide methods almost always use a linear gradient of increasing organic modifier (typically acetonitrile) in water with an ion-pairing agent such as TFA. A steep gradient (for example, 5-95% acetonitrile over 15 minutes) compresses peaks together and shortens run time, but it also collapses closely eluting impurities into the main peak. A shallow gradient (5-95% over 60 minutes) spreads peaks apart and reveals impurities the steep method hides. The same sample can legitimately report different purity percentages under the two methods, and neither is wrong.
Column Chemistry and Dimensions
Most peptide work uses a C18 stationary phase, but C8, C4, and mixed-mode columns behave differently. A C4 column retains hydrophobic peptides less strongly than C18, which can improve recovery of very hydrophobic sequences but reduce resolution of closely related impurities. Column length and particle size matter too: a 150 mm column packed with 3 µm particles resolves more than a 50 mm column with 5 µm particles, at the cost of higher backpressure and longer run time.
Mobile Phase pH and Ion Pairing
Peptides are ionizable, and their charge state depends on pH. Changing mobile phase pH shifts retention, sometimes dramatically, and can flip elution order between the main peak and an impurity. TFA concentration affects ion pairing and peak shape; substituting formic acid for TFA is common in LC-MS work but typically produces broader peaks and different selectivity than the TFA method used for purity analysis.
Temperature and Flow Rate
Column temperature affects both retention and selectivity. A 5 °C change can shift retention time enough to complicate peak identification against a reference standard. Flow rate changes retention time and backpressure; increasing flow shortens run time but can reduce resolution if the gradient volume is not scaled accordingly.
Integration Parameters, The Hidden Variable
This is the factor most guides ignore. Software decides where each peak begins and ends, and those decisions change the denominator in the area-percentage calculation. Key settings include:
- Peak threshold, the minimum height or area for a peak to be counted. Set it too high and real impurities disappear from the calculation; set it too low and baseline noise is integrated as sample.
- Baseline correction, how the software draws the baseline under and between peaks. Aggressive correction can absorb small impurity peaks into the main peak's area.
- Shoulder detection, whether the software splits an unresolved shoulder into a separate peak or merges it into the main peak.
- Tangent skim vs. drop-line, the algorithm used to separate partially resolved peaks, which can shift several percentage points of area between the main peak and its neighbor.
Two labs can run the identical sample on the identical method and report different purity numbers purely because of these settings. A 98% result from a lab using a high threshold and a 98% result from a lab counting every detectable peak are not the same claim.
Why This Matters for Reproducibility
When you receive a Certificate of Analysis, check whether the method details are included. A purity figure without column type, gradient, detection wavelength, and integration parameters is difficult to reproduce or challenge. If a result looks anomalously high, the first question is not whether the peptide is pure, it is what the integration threshold was set to.
Conclusion
Reading a chromatogram well is a skill, and it is the difference between trusting a purity claim and verifying one. Globo Research Peptides supports that work with verified ≥99% HPLC purity, full Certificate of Analysis documentation for every batch, rigorous third-party testing, and a special-order fulfillment program for compounds that are harder to source. ORDER NOW
Frequently Asked Questions
How do I interpret an HPLC chromatogram for peptide purity?
Locate the main peptide peak, which is typically the tallest and sharpest signal. Calculate its area as a percentage of the total area of all peaks. A purity of 99% or higher means the main peak accounts for at least 99% of the total integrated area. Check for baseline stability, peak symmetry, and any small peaks that indicate impurities. Always cross-reference with the Certificate of Analysis provided by your supplier.
How do I calculate peptide purity percentage from an HPLC chromatogram?
Use the area percentage method: divide the area of the main peptide peak by the sum of all peak areas, then multiply by 100. Most chromatography software performs this automatically after peak integration. Ensure your integration parameters, such as baseline assignment and slope sensitivity, are set consistently. Small changes in integration settings can shift reported purity by 0.5% or more, so document your method for reproducibility.
What is the difference between an HPLC peak and an impurity peak?
The main peptide peak corresponds to your target compound and usually appears at a known retention time with a symmetrical shape. Impurity peaks are smaller signals that elute at different retention times, indicating truncated sequences, deletion products, or oxidation byproducts. Not every small peak is an impurity; solvent artifacts and system peaks can also appear. Compare against a blank injection and reference standards to distinguish them.
Why is mass spectrometry often used alongside HPLC for peptide validation?
HPLC separates and quantifies components but cannot confirm molecular identity. Mass spectrometry measures the molecular weight of the eluting peptide, verifying that the main peak matches the expected sequence. Combining HPLC for purity assessment with LC-MS for identity confirmation gives a complete picture. This dual approach is standard for research-grade peptides where both purity and sequence accuracy matter for experimental reproducibility.
What role does the baseline play in reading a chromatogram?
The baseline is the steady signal level when no analyte is eluting. A flat, stable baseline ensures accurate peak integration. Drifting or noisy baselines, caused by gradient changes, column contamination, or detector issues, can inflate or deflate peak areas and skew purity calculations. Always inspect the baseline before trusting the reported area percentage. Running a blank gradient helps identify baseline artifacts.
How do I know if a Certificate of Analysis HPLC result is reliable?
A reliable Certificate of Analysis includes the chromatogram image, integration table, column type, mobile phase composition, gradient program, detection wavelength, and retention time. Look for batch-specific data rather than generic specifications. If the documentation lacks method details or shows a single unlabeled peak, request a full analytical report before purchasing.