 ultimate-guide
Understanding HPLC Peptide Analysis Reports
Table of Contents
- What Is HPLC and Why It Matters for Peptide Analysis
- How HPLC Works: The Separation Process Explained
- Interpreting Peptide Chromatograms and Peak Data
- Understanding Peptide Purity Percentages and Quality Standards
- How to Verify Peptide Sequence Accuracy After Purchase
- HPLC vs LC-MS Peptide Purity: Which Method Tells You More
- Reading Your Certificate of Analysis: What Every Section Means
- Common Impurities and Artifacts in HPLC Reports
- Frequently Asked Questions
Last Updated: September 24, 2026
What Is HPLC and Why It Matters for Peptide Analysis
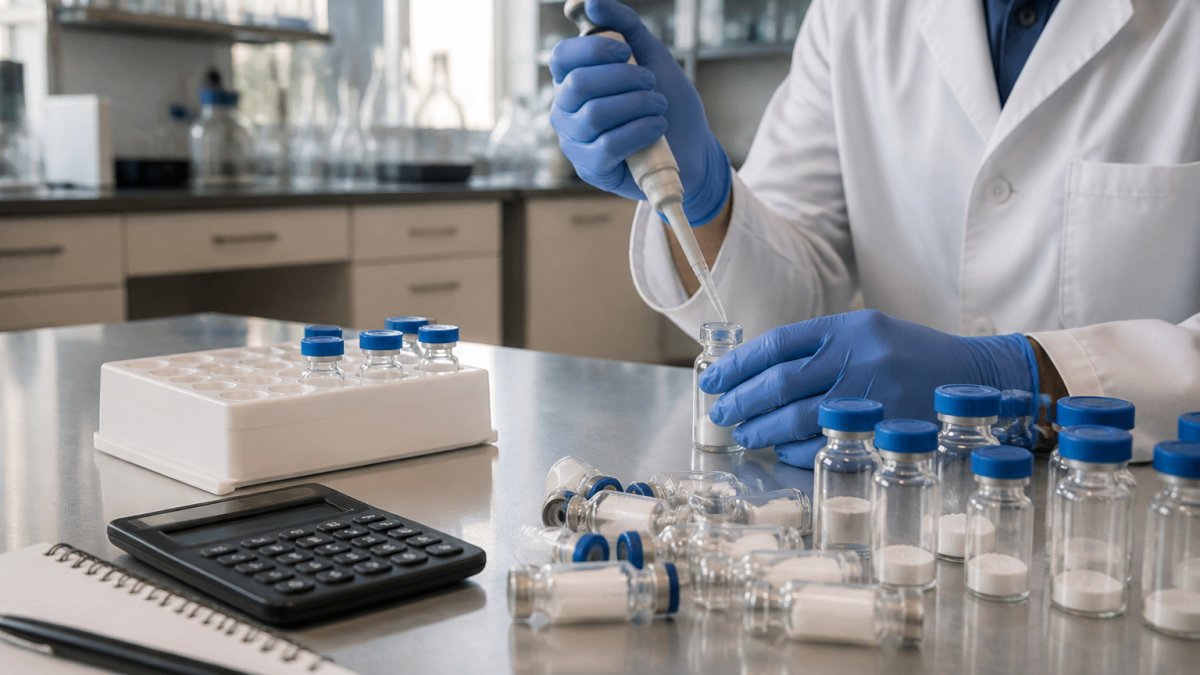
High-performance liquid chromatography, or HPLC, is the gold standard analytical method for determining peptide purity and identity in research laboratories. At Globo Research Peptides, we use HPLC peptide analysis to verify that every batch meets our ≥99% purity standard before it reaches your lab. This technique separates peptide molecules based on their chemical properties, allowing us to quantify exactly what's in your sample and what impurities might be present.
HPLC peptide analysis matters because it's the most reliable way to confirm you're getting what you paid for. When you order a research-grade peptide, the certificate of analysis attached to your shipment is built on HPLC data. Without it, you're working blind, potentially using contaminated material that invalidates months of research.
The separation happens through a simple principle: different molecules move through a column at different speeds. The stationary phase (the column material) interacts with your peptide sample in predictable ways. The mobile phase (liquid solvent) carries the peptide through. Molecules that interact strongly with the column stay longer; those that don't move quickly. This difference in retention time is how HPLC identifies and quantifies what's actually in your sample.
Understanding your HPLC peptide analysis report is non-negotiable if you're working with synthetic peptides. The numbers on that page determine whether your study is sound or whether you're chasing artifacts caused by impurities.
How HPLC Works: The Separation Process Explained
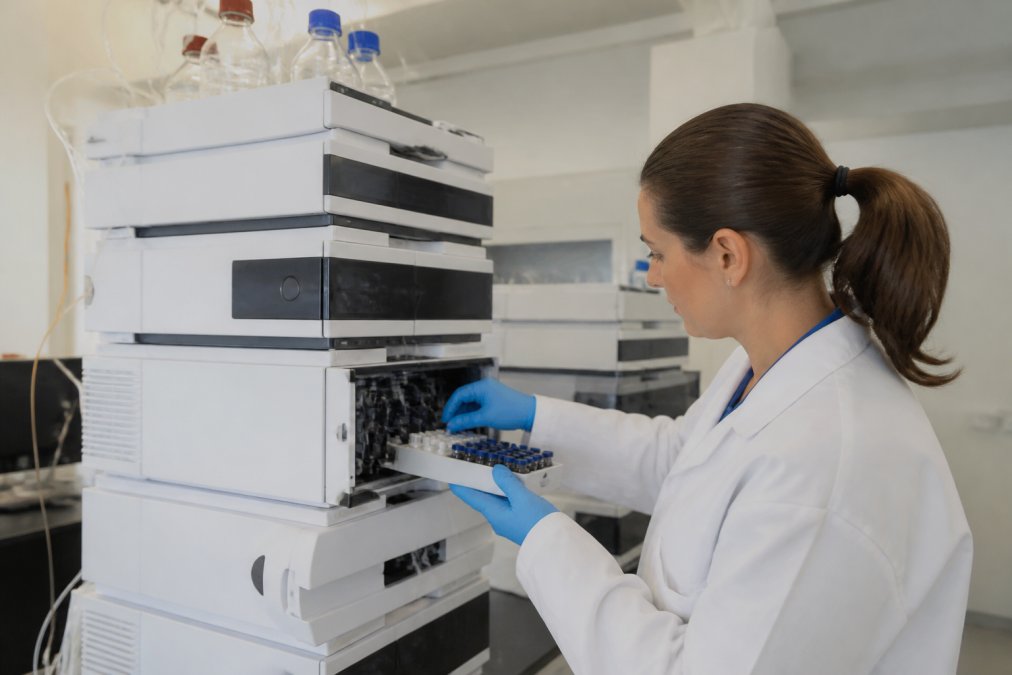
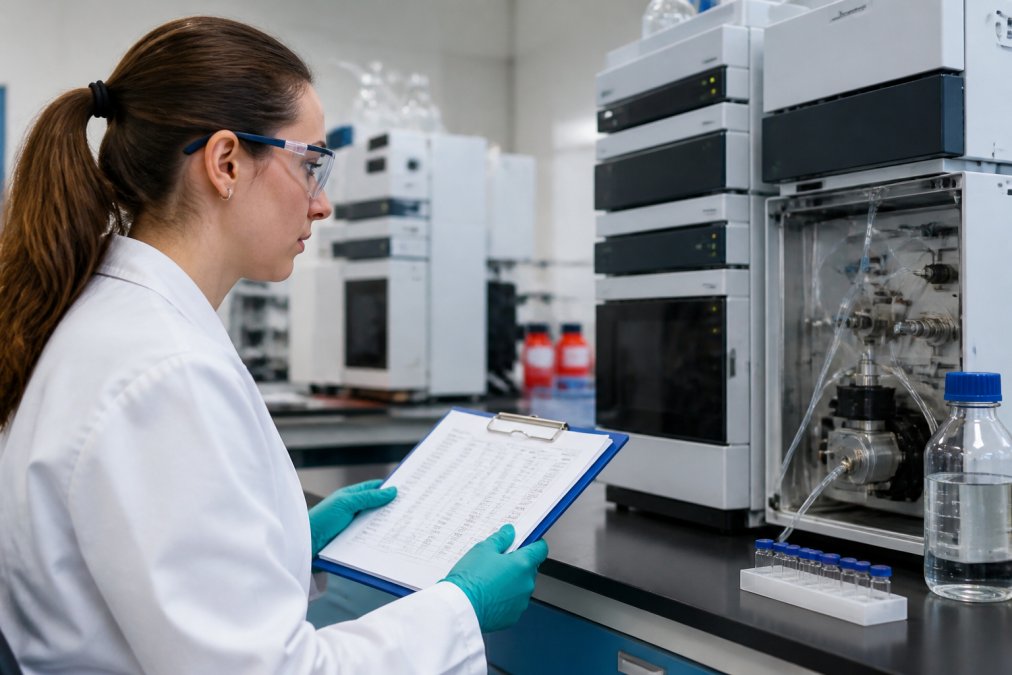
The separation process in HPLC peptide analysis starts the moment your sample enters the column. A high-pressure pump forces the mobile phase through the stationary phase at precise flow rates, typically measured in milliliters per minute. This pressure (often 100-300 bar) is what gives HPLC its name and its power.
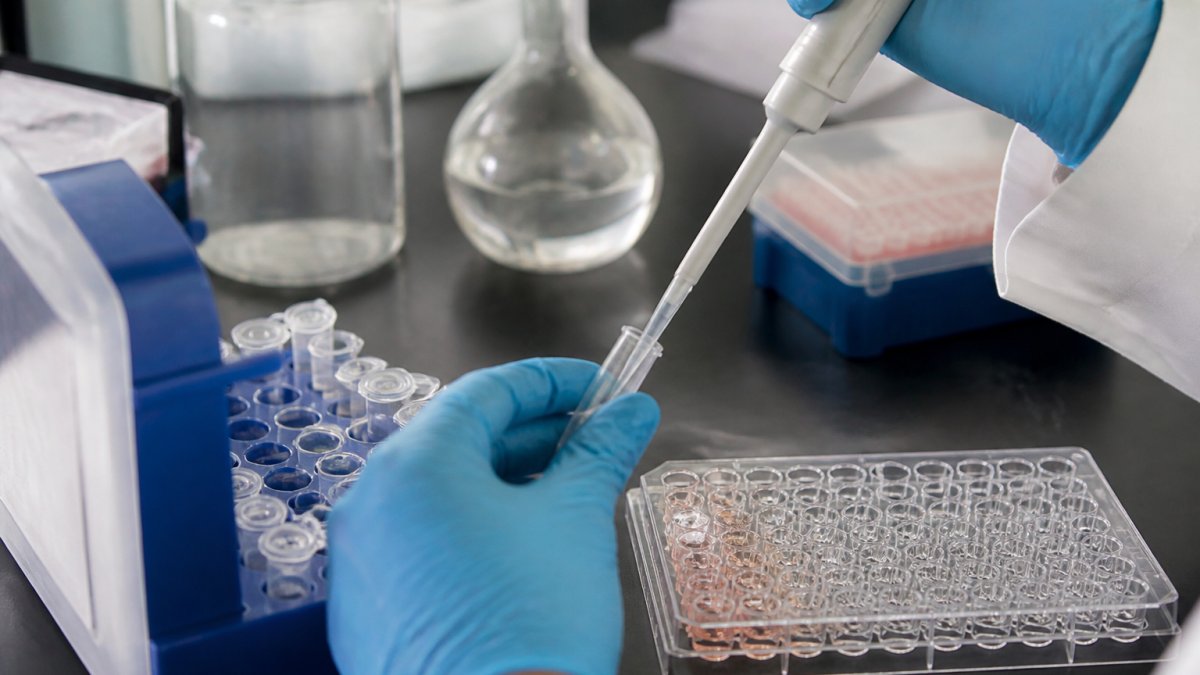
Your peptide sample is injected into the flowing mobile phase. As it moves through the column, each component in your sample interacts with the stationary phase differently. A peptide with strong hydrophobic character might stick to a reversed-phase column longer than a more polar peptide. This difference in interaction creates separation, the chromatogram shows distinct peaks for each component that exits the column at different times.
At the column exit, a detector measures what's coming out. For peptides, ultraviolet (UV) detection at 214 nanometers is standard, peptide bonds absorb strongly at this wavelength. The detector generates a signal proportional to the amount of peptide passing through. This signal becomes the peaks you see on the chromatogram.
The entire process takes minutes to hours, depending on method complexity. A gradient elution, where the mobile phase composition changes over time, helps separate peptides that wouldn't separate under constant conditions. Early in the gradient, the mobile phase is less "strong," so only weakly retained compounds elute. As the gradient progresses, more organic solvent enters, eluting more strongly retained peptides. This controlled elution is what creates the characteristic peaks in your report.
Interpreting Peptide Chromatograms and Peak Data
A peptide chromatogram is a graph of detector signal versus time. The x-axis shows elapsed time (in minutes); the y-axis shows signal intensity (in millivolts or absorbance units). Each peak represents a distinct chemical component exiting the column.
The retention time is the time at which a peak reaches its maximum. It's a fingerprint for that molecule under those specific conditions. If your peptide elutes at 12.3 minutes on Monday and 12.5 minutes on Friday, that's normal variation. If it elutes at 8 minutes instead, something has changed, either the column, the method, or your sample.
Peak area is the total signal integrated under a peak. It's proportional to the amount of that component in your sample. If your main peptide peak has an area of 9,850 and an impurity peak has an area of 150, the purity calculation divides the main peak by the total: 9,850 ÷ (9,850 + 150) = 98.5%. This is your purity percentage.
Baseline noise matters more than most researchers realize. If your baseline is unstable or drifts, small impurities can hide in the noise or false peaks can appear. A clean baseline, flat and stable, makes real peaks stand out. Signal-to-noise ratio compares peak height to baseline noise. A ratio of 10:1 or higher is generally considered reliable; below 5:1, you're in risky territory.
Resolution is how well two peaks separate from each other. If two impurities co-elute (exit at the same time), they appear as one peak. You can't quantify them separately. Good resolution means each component gets its own peak, giving you the true purity picture. Poor resolution can hide impurities or make one impurity look like two.
Understanding Peptide Purity Percentages and Quality Standards
Purity percentages in HPLC peptide analysis reports are calculated from peak areas. The main peptide peak is divided by the sum of all peaks. A report showing 99.2% purity means the target peptide accounts for 99.2% of all material detected.
This number has limits you need to understand. HPLC detects what absorbs at 214 nanometers. Some impurities don't absorb well at this wavelength and go undetected. Salts, some inorganic counter-ions, and water don't show up. A peptide that's 99% pure by HPLC might be 97% pure by mass if significant salt is present. This is why the certificate of analysis often lists both HPLC purity and water content separately.
The ≥99% standard used by Globo Research Peptides reflects industry best practice for research-grade peptides. This threshold minimizes the risk that impurities will confound your results.
How to Verify Peptide Sequence Accuracy After Purchase
Sequence verification starts with the certificate of analysis. The COA should list the peptide sequence explicitly, not just a catalog number or product name. If your order was for a 15-amino-acid peptide and the COA shows a 14-amino-acid sequence, stop. Contact the supplier immediately.
HPLC vs LC-MS Peptide Purity: Which Method Tells You More
HPLC gives you purity based on UV absorbance. LC-MS (liquid chromatography-mass spectrometry) combines separation with mass detection. Both methods have strengths and limitations.
Reading Your Certificate of Analysis: What Every Section Means
A certificate of analysis for a research-grade peptide includes several standard sections. The product information section lists the peptide name, sequence, catalog number, lot number, and quantity. This is your verification that you received the right product. Cross-check the sequence against your purchase order.
Common Impurities and Artifacts in HPLC Reports
Deletion sequences are the most common impurity in synthetic peptides. During synthesis, the coupling reaction occasionally fails at one position. The peptide continues to grow, but one amino acid is missing. This deletion product is shorter by one amino acid mass unit and typically elutes earlier in HPLC. It absorbs at 214 nanometers and counts against your purity.
Frequently Asked Questions
What is a good HPLC purity percentage for research peptides?
For research-grade peptides, purity of 95% or higher is generally acceptable for most studies, though many researchers prefer ≥98% for sensitive applications like receptor binding assays or pharmacokinetic profiling. High-purity peptides minimize background noise and ensure that observed effects come from your target compound rather than impurities. Your specific requirement depends on your analytical method and study design, always verify purity matches your protocol before beginning experiments.
How do I interpret the peaks on an HPLC chromatogram?
Each peak represents a distinct compound separated by the column. The peak's position (retention time) identifies the compound; its height and area indicate concentration. A single sharp peak at the expected retention time suggests high purity. Multiple peaks suggest impurities or degradation products. The baseline should be flat and stable; noise or irregular baseline indicates potential instrument issues. Always compare your chromatogram to the reference standard provided in your Certificate of Analysis.
What is the difference between HPLC and LC-MS in peptide analysis?
HPLC measures purity by separation and absorbance detection, giving you composition data and percentage breakdown. LC-MS (liquid chromatography-mass spectrometry) adds molecular weight confirmation, identifying exact peptide identity and detecting structural variants. HPLC is faster and less expensive; LC-MS provides definitive identity verification. For critical studies, many labs use HPLC for purity screening and LC-MS for confirmation of peptide sequence accuracy and detection of unexpected modifications.
Why is batch consistency important when ordering multiple peptide batches?
Batch-to-batch variability can affect reproducibility of your research results. Different synthesis runs may show slight variations in impurity profiles, counter-ion composition, or residual solvent levels, all documented in the Certificate of Analysis. Reviewing COA data across batches helps you identify whether variations are within acceptable limits. If you notice significant changes in purity or new impurities appearing, request reanalysis or discuss with your supplier before using the batch in critical experiments.
What should I do if my HPLC report shows unexpected peaks or low purity?
First, verify that the chromatogram matches the expected retention time and molecular weight from your Certificate of Analysis. Check whether the sample was stored correctly and hasn't degraded. Review the method parameters, changes in mobile phase, column, or gradient can shift retention times. If purity is genuinely below specification, contact your supplier immediately with your batch number and COA. Request reanalysis or a replacement batch. Document the issue for your study records in case it affects your results.
How do counter-ions affect HPLC reports and peptide quality?
Peptides are often supplied as salts (acetate, hydrochloride, or TFA counter-ions) to improve stability and solubility. The counter-ion is listed in your Certificate of Analysis and affects the peptide's molecular weight calculation. Different counter-ions can influence solubility in your experimental buffer and may affect binding assays. Always confirm the counter-ion specification matches your protocol requirements before use. If your study requires a specific counter-ion form, verify this in the COA before purchase.
Can I rely on HPLC purity alone to confirm my peptide is correct?
HPLC confirms purity and consistency but does not definitively prove peptide sequence identity, it only measures separation and absorbance. Two different peptides with similar molecular weight could produce similar HPLC profiles. For absolute sequence confirmation, pair HPLC with mass spectrometry (LC-MS) or amino acid sequencing. Your Certificate of Analysis should include both HPLC purity data and molecular weight confirmation. For high-stakes research, request LC-MS verification as part of your quality assurance process.