 ultimate-guide
High Purity Peptides for Receptor Binding: A 2026 Guide
Table of Contents
- Why High Purity Peptides Are Critical for Receptor Binding Studies
- Defining Purity Standards for Research-Grade Peptides
- Is 98% Purity Good for Peptides? Understanding the Threshold
- Peptide Purity Analysis Methods: HPLC, Mass Spectrometry, and Beyond
- Impact of Peptide Impurities on Binding Affinity and Assay Sensitivity
- Purity vs. Bioactivity: The Correlation Competitors Miss
- Stability in Buffer Solutions: A Hidden Factor in Receptor Binding
- Cost-Benefit Analysis of Purity Grades for Research Applications
- Conclusion: Choosing High Purity Peptides for Reliable Receptor Binding
- Frequently Asked Questions
Last Updated: September 13, 2026
Why High Purity Peptides Are Critical for Receptor Binding Studies
High purity peptides for receptor binding are synthetic peptides with a verified purity level high enough that contaminating sequences do not interfere with ligand-receptor interaction measurements. At Globo Research Peptides, we supply research-grade compounds with verified ≥99% HPLC purity and full Certificate of Analysis documentation for every batch.
A peptide that is 95% pure is not simply "5% less good (PubMed)." That remaining 5% can consist of truncated sequences, deletion analogs, or scrambled isomers that bind the same receptor with different affinity, so your calculated dissociation constant describes a mixture, not your compound of interest.
Purity verification belongs at the center of study design, not in a footnote. Below: what purity thresholds mean for receptor work, how to verify them, and where the trade-offs sit.
Defining Purity Standards for Research-Grade Peptides
Peptide purity is the percentage of total peptide mass matching your intended sequence, measured by techniques such as high-performance liquid chromatography. It is a relative figure, not an absolute guarantee of quality, and treating it as a single number is a mistake. Two orthogonal measurements matter:
- Chromatographic purity (typically by HPLC): the proportion of the sample eluting as the target peak
- Mass confirmation (typically by mass spectrometry): whether the dominant species has the correct molecular weight
- Counterion and water content: the portion of the sample that is neither peptide nor impurity
A sample can show a clean single HPLC peak and still fail sequence verification, or pass mass accuracy checks while hiding co-eluting impurities of similar mass. Research-grade materials should be documented with both.
Is 98% Purity Good for Peptides? Understanding the Threshold
For most routine receptor binding assays, 98% purity is acceptable. (peer-reviewed research) The question is not "is 98% good?" but "is 98% good enough for what this assay can detect?" Many laboratories find 98% performs reliably for screening, competition assays with generous signal windows, and initial characterization, because the impurity load rarely shifts a result outside the assay's own variability. Where 98% starts to matter is when your readout is sensitive to small differences in ligand concentration: resolving subtle potency differences between analogues, or measuring kinetics with tight confidence intervals, makes the impurity fraction a variable you did not intend to introduce.
When 98% Purity Is Sufficient for Receptor Binding
Three situations where 98% is usually the right call:
- Screening and triage: ranking many compounds, only relative performance needed
- Well-characterized systems: receptor, buffer, and assay window already validated
- Generous signal-to-noise: positive control separates widely from baseline
Here, paying for higher purity adds documentation cost without changing the conclusion.
When Higher Purity Is Required
Higher purity becomes necessary when the impurity itself is biologically active at your working concentration.
- Potency comparisons between close analogues: a truncated sequence can shift apparent affinity
- Kinetic measurements: association and dissociation rates are sensitive to competing species
- Low-concentration work: at nanomolar and below, trace impurities are a larger molar fraction of what binds
- Publication-bound data: reviewers expect documented purity and sequence verification
Peptide Purity Analysis Methods: HPLC, Mass Spectrometry, and Beyond
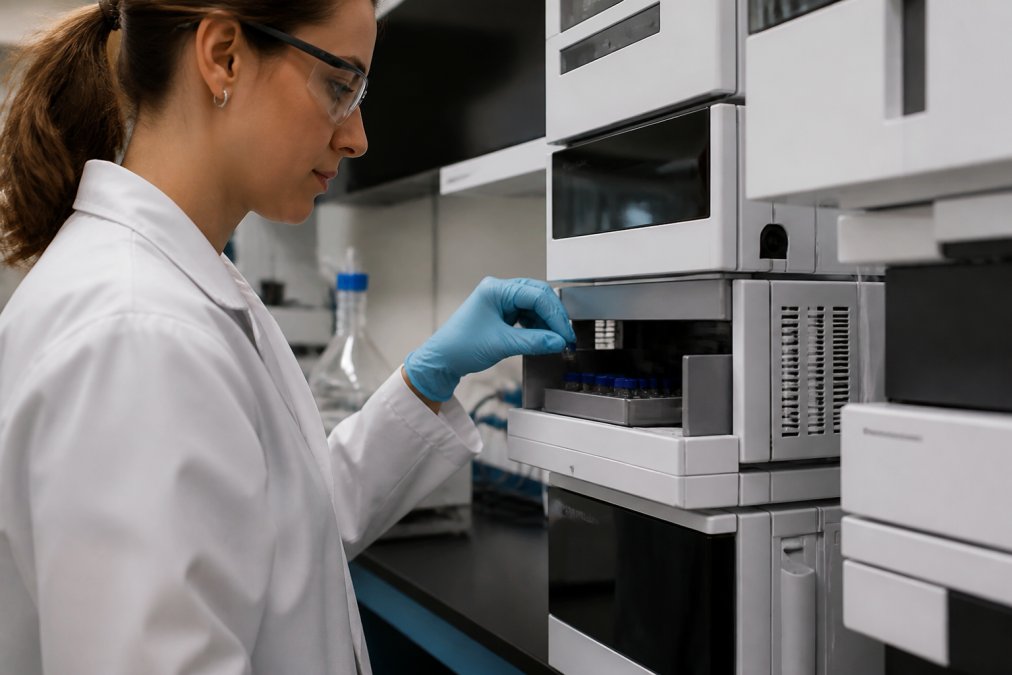
Reversed-phase HPLC and mass spectrometry are the two workhorse methods for peptide purity analysis, answering different questions: HPLC tells you how much of your sample is the target species; mass spectrometry tells you whether that species has the correct structure.
High-Performance Liquid Chromatography (HPLC)
HPLC separates sample components by their interaction with a stationary phase, and purity is calculated from the area under the target peak relative to total peak area. The number depends entirely on the method: a shallow gradient with UV detection at 214 nm resolves more impurity peaks than a steep gradient at 280 nm. A purity figure is meaningless without the method parameters attached.
Mass Spectrometry for Sequence Verification
Mass spectrometry confirms the dominant species has the expected molecular weight, catching errors HPLC cannot: a deletion analog with similar hydrophobicity may co-elute with your target but will show a mass shift. Electrospray ionization in positive mode is standard, and mass accuracy within a few parts per million is sufficient to distinguish most sequence variants.
Impact of Peptide Impurities on Binding Affinity and Assay Sensitivity
Impurities change binding measurements in two distinct ways: they compete for the receptor, and they interfere with the assay itself. Both push your data away from the truth, and they do not cancel out.
The competitive effect: if 2% of your sample is a truncated sequence that retains receptor affinity, your apparent dissociation constant reflects a mixture of two ligands, with the shift depending on the impurity's affinity and molar fraction. The assay effect is subtler: non-specific binding from contaminating sequences raises background signal, compressing your assay window so small differences between compounds disappear into noise.
The Four Impurity Classes You Will Actually See
Synthetic peptide impurities are not a single category. Each class interferes through a different mechanism and is caught (or missed) by a different analytical method.
Truncated sequences (deletion peptides). These arise when a coupling step fails during solid-phase synthesis and the chain continues without that residue. They are the most common synthetic peptide impurity. Behavior varies: some lose all receptor affinity and dilute your sample; others retain partial binding and act as weak competitors; a few show altered selectivity. Because a single-residue deletion often changes hydrophobicity only slightly, a truncated sequence can co-elute with your target on reversed-phase HPLC and pass a purity check.
Deletion and insertion analogs from incomplete deprotection. When a protecting group is not fully removed, the next residue can fail to couple or couple at the wrong position, producing a sequence differing by one or two residues. These are the most dangerous class for potency comparisons because they bind the same pocket with a meaningfully different affinity.
Scrambled isomers (racemization products). During coupling, the alpha-carbon of an activated residue can racemize, converting an L-amino acid to its D-form. A single D-residue can alter binding pose without changing molecular weight, so mass spectrometry will not flag it and HPLC may not resolve it. This class is most likely to survive every routine check.
Counterions, water, and residual solvents. Trifluoroacetate (TFA), the standard ion-pairing agent in reversed-phase purification, is hard to remove completely. It contributes non-peptide mass and can affect solubility and, in some assays, the apparent pH of a working stock. A sample reported as 98% pure by HPLC may be considerably less than 98% peptide by mass once counterion and water content are accounted for.
Why the Molar Fraction Matters More Than the Percentage
The percentage is a distraction at low concentrations. What governs interference is the impurity's molar fraction relative to your working concentration of target peptide.
Consider a peptide used at 1 nM in a competition assay. A 2% impurity load means roughly 20 pM of contaminating species. If that impurity binds the same receptor with an affinity within an order of magnitude of your target, it is a co-ligand at a concentration that can shift an IC50. At 1 micromolar, the same 2% impurity is 20 nM, but the target is a thousand-fold higher, and the impurity's relative contribution to occupancy collapses. The lower your working concentration, the more a fixed percentage of impurity matters.
The Assay-Side Effects
Impurities do not only compete for the receptor; they also interfere with the measurement itself.
- Plastic adsorption. Hydrophobic impurity species stick to polystyrene plates, pipette tips, and filter membranes, reducing effective compound concentration in ways that vary between plate lots.
- Background inflation. Non-specifically binding contaminating sequences raise baseline signal, compressing the assay window and reducing resolution between your best compounds.
- Fluorescence and absorbance interference. In fluorescence polarization or labeled-ligand assays, residual aromatic impurities or scavenger species can contribute signal independently of binding.
A Worked Example of the Failure Mode
A common pattern: a laboratory compares two close analogs and finds analog B appears roughly twice as potent as analog A. That difference is within the range a 2-3% active impurity could produce. Without sequence verification by mass spectrometry and a documented chromatogram, there is no way to know whether the result reflects a real structure-activity relationship or an impurity artifact, and any follow-up study inherits the error.
What to Ask For
When resolving differences between close analogs, request the chromatogram, mass spectrum, HPLC method parameters (column, gradient, detection wavelength), and a statement of counterion and water content. A purity percentage alone does not let you audit any of the mechanisms above.
FDA guidance on analytical procedures and methods validation for drugs and biologics
Purity vs. Bioactivity: The Correlation Competitors Miss
Purity and bioactivity do not scale linearly, and chasing the highest available percentage is often the wrong optimization.
What matters is whether the impurity fraction is biologically inert at your working concentration. A 97% pure sample where the 3% is a biologically silent deletion product will outperform a 99.5% sample where the residual is an active analog. Think in terms of purity threshold rather than maximum purity: the point above which further purification does not change your measured result. For screening, that might be 95%; for kinetics resolving close analogues, 99% or above.
Stability in Buffer Solutions: A Hidden Factor in Receptor Binding
Purity at shipment and purity at assay are two different numbers, and buffer conditions sit between them. A well-documented 99% peptide can quietly become a 90% peptide before it reaches the receptor.
The Three Degradation Pathways That Matter in Binding Buffers
Peptide instability in buffer is not a single process. Three mechanisms dominate.
Hydrolysis of the peptide backbone. The peptide bond is susceptible to acid- and base-catalyzed hydrolysis, with the rate depending on pH and adjacent residues. Aspartate-proline (Asp-Pro) bonds are the classic labile site and can cleave under mildly acidic conditions. Asparagine and glutamine side chains deamidate to aspartate and glutamate, shifting mass by roughly one dalton and potentially altering receptor contacts. Deamidation is fastest at neutral to slightly basic pH and commonly causes a peptide that assays fine on day one to drift by day seven.
Oxidation. Methionine, cysteine, and to a lesser extent tryptophan and histidine are oxidation-prone. Methionine sulfoxide formation adds 16 Da and frequently abolishes or reduces receptor affinity when the methionine sits in the binding epitope. Oxidation is accelerated by dissolved oxygen, trace metal ions (particularly copper and iron), and light.
Aggregation and adsorption. Hydrophobic sequences self-associate in aqueous buffer. Aggregates can bind non-specifically to the receptor or assay surface and inflate apparent affinity. Adsorption to plastic and glass is a separate loss mechanism that reduces effective compound concentration without changing measured purity.
Buffer-Specific Guidance
Different binding buffers stress peptides differently. The table below summarizes the dominant risk in each common buffer system and its mitigation.
| Buffer system | Typical pH | Dominant degradation risk | Practical mitigation |
|---|---|---|---|
| Phosphate-buffered saline (PBS) | 7.4 | Deamidation of Asn/Gln; slow hydrolysis | Prepare fresh weekly; store at 4 °C; avoid repeated warming |
| Tris-HCl | 7.5-8.5 | Deamidation accelerated at higher pH; Tris can react with some crosslinkers | Keep pH at the low end of the working range; use within days |
| HEPES | 7.0-7.6 | Generally gentle; photo-oxidation of HEPES itself generates radicals | Protect from light; do not store HEPES buffers long-term |
| Acetate or citrate | 4.0-5.5 | Asp-Pro cleavage; reduced deamidation | Use for short-term work only; verify sequence has no Asp-Pro |
| Borate | 8.0-9.0 | Rapid deamidation; base-catalyzed hydrolysis | Avoid for long incubations; use only if required by the assay |
Time Course and Temperature
Treat buffer stability as a time course, not a binary. A peptide stable for four hours at room temperature may be substantially degraded after twenty-four hours at 37 °C, which matters for overnight equilibrium binding experiments.
A practical rule of thumb:
- Working stocks (diluted in assay buffer): prepare fresh the day of the experiment; discard at end of day.
- Intermediate stocks (in buffer, no carrier): stable for days at 4 °C for most sequences, but verify by re-running HPLC if publication-bound.
- Master stocks (lyophilized or in organic solvent such as DMSO or acetonitrile): stable for months to years when stored correctly; do freeze-thaw cycling here, not on the working stock.
Sequence-Level Risk Assessment
Before committing to a buffer and protocol, check your sequence:
- Asp-Pro? Avoid acidic buffers and long incubations.
- Asn or Gln? Expect deamidation at neutral-to-basic pH; keep incubations short and cold.
- Met, Cys, or Trp? Plan for oxidation; consider a mild reducing agent such as dithiothreitol (DTT) or tris(2-carboxyethyl)phosphine (TCEP) if the assay tolerates it, and degas buffers.
- Highly hydrophobic? Expect aggregation and adsorption; add low-concentration carrier protein such as bovine serum albumin (BSA) and consider passivating plasticware.
- Positively charged? Expect adsorption to glass and some plastics; use low-binding tubes.
Practical Habits That Reduce the Risk
- Prepare fresh working stocks rather than repeatedly freeze-thawing aliquots.
- Match dilution buffer to assay buffer so the peptide never experiences a pH or ionic-strength jump.
- Include low-concentration carrier protein for adsorption-prone peptides.
- Degas buffers and store protected from light to slow oxidation.
- Check buffer compatibility for your sequence before committing to a protocol.
- For long equilibrium experiments, run a parallel no-receptor control to detect signal drift from peptide loss or aggregation.
Why This Matters for Purity Claims
A Certificate of Analysis describes the peptide as it left the supplier, not the peptide in your assay well three hours later. Close that gap by treating buffer stability as part of experimental design and verifying, at least once, that your peptide survives your actual assay conditions intact.
Cost-Benefit Analysis of Purity Grades for Research Applications
Pricing depends on sequence length, synthesis complexity, purification level, and quantity, so no single figure applies. What you can evaluate is the cost of getting it wrong: a failed study costs the compound, assay reagents, instrument time, and weeks of unusable data. Higher purity grades are a fraction of that cost when they prevent a repeat.
For most laboratories, the right split looks like this:
| Application | Recommended Purity | Why |
|---|---|---|
| Screening and triage | 95-98% | Impurity load rarely changes ranking |
| Standard binding assays | ≥98% | Adequate signal-to-noise for most systems |
| Kinetic and potency studies | ≥99% | Small affinity differences must be resolved |
| Publication-bound data | ≥99% with full documentation | Reviewers expect auditable verification |
The case for higher grades is strongest when your assay is sensitive and your timeline tight, and weakest when triaging a large library where only relative performance matters.
Conclusion: Choosing High Purity Peptides for Reliable Receptor Binding
The hardest part of receptor binding work is not the assay. It is knowing the compound going into the well is what the label says it is.
Globo Research Peptides addresses that directly. Every batch ships with verified ≥99% HPLC purity, full Certificate of Analysis documentation, and rigorous third-party testing by accredited laboratories, so your analytical validation starts from a documented baseline rather than a claim. Our special-order fulfillment program covers compounds outside standard inventory, and in-stock items are ready for immediate dispatch.
Order now and give your binding studies materials you can actually audit.
Frequently Asked Questions
Is 98% purity sufficient for receptor binding studies?
It depends on the assay. For initial screening or high-abundance receptors, 98% purity may work. However, for sensitive assays, G protein-coupled receptors, or studies measuring dissociation constants, 2% impurities can cause non-specific binding and skew results. High purity peptides of 99% or higher are recommended for critical binding kinetics and ligand potency studies.
How do impurities in peptides affect receptor binding affinity?
Impurities such as truncated sequences or deletion peptides can compete with the target peptide for receptor binding, lowering apparent affinity. They may also cause peptide aggregation or alter conformational stability, reducing effective concentration. This leads to inaccurate dissociation constant values and poor reproducibility. Using high purity peptides with verified mass accuracy minimizes these risks.
What peptide purity analysis methods are most reliable?
High-performance liquid chromatography (HPLC) is the standard for quantifying purity, while mass spectrometry confirms molecular weight and sequence verification. Third-party testing by accredited laboratories adds an extra layer of confidence. For research-grade materials, always request a Certificate of Analysis (CoA) that includes both HPLC and mass spectrometry data.
Why is a Certificate of Analysis essential for high purity peptides?
A CoA documents the peptide's purity, identity, and testing methods. Without it, you cannot verify claims like ≥99% HPLC purity or confirm the absence of truncated sequences. For receptor binding studies, a CoA ensures the material meets your assay requirements and provides traceability for reproducibility. Reputable suppliers like Globo Research Peptides provide full CoA documentation for every batch.