 ultimate-guide
How to Read Mass Spectrometry Data: A Beginner's Guide
Table of Contents
- Mass Spectrometry Data: What You're Actually Looking At
- Step 1: Start With the m/z Axis and the Base Peak
- Step 2: Find the Molecular Ion to Confirm Molecular Weight
- Step 3: Read Fragmentation Patterns to Verify Your Peptide Sequence
- Step 4: How to Read LC-MS Data for Purity and Impurities
- What to Check on a Mass Spectrometry Certificate of Analysis
- Common Pitfalls and Troubleshooting Artifacts
- Conclusion
- Frequently Asked Questions
Last Updated: September 5, 2026
Learning how to read mass spectrometry data is a core skill for anyone verifying the identity and purity of a research compound, yet most guides assume more prior knowledge than you likely have. In this guide from Globo Research Peptides, we break down the process into clear steps, starting from the raw spectrum and ending with a practical check of your Certificate of Analysis. Reading mass spectrometry data is the process of interpreting a plot of ion abundance against mass-to-charge ratio to determine molecular weight and structural information. By the end, you will be able to confirm whether a peptide batch matches its documentation, which is critical when your study timeline depends on material integrity. This skill supports peptide sequence verification and helps you avoid costly experimental setbacks.
Mass Spectrometry Data: What You're Actually Looking At
A mass spectrometry data file is a visual record of ions separated by their mass-to-charge ratio, usually presented as a spectrum with peaks on a plot. The horizontal axis shows the m/z value, and the vertical axis shows relative abundance, or how much of each ion is present compared to the tallest peak. That tallest peak, set to 100% intensity, is the base peak.
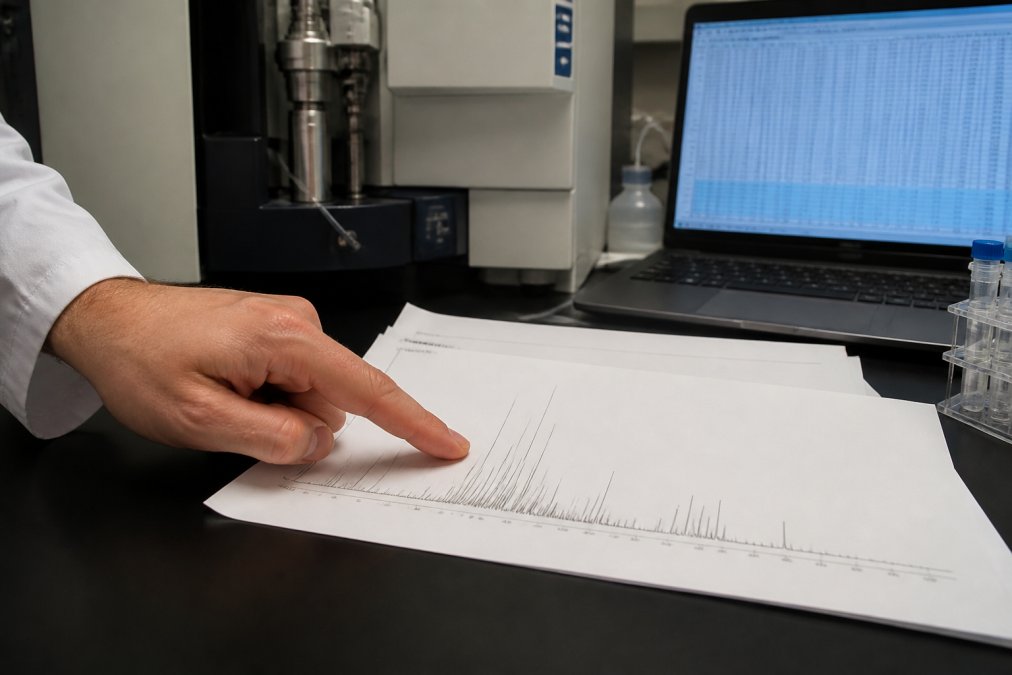
Before interpreting anything, confirm you are viewing the correct raw data file for your sample. A common mistake is analyzing a blank or solvent run, which produces a chromatogram with no meaningful peaks. Check the acquisition method and sample ID in the header of the file to ensure the data corresponds to your compound.
Step 1: Start With the m/z Axis and the Base Peak
The first step in reading mass spectrometry data is to locate the base peak, since it anchors your interpretation of relative abundance. Every other peak's height is expressed as a percentage of this tallest signal. For a purified peptide analyzed by electrospray ionization, the base peak often corresponds to a multiply charged molecular ion, not a fragment.
Look across the m/z axis for the highest-intensity signal and note its value. Then scan for clusters of peaks that share a consistent spacing, which often indicates a charge state series. Multiply charged ions appear as several peaks with different m/z values that all represent the same intact molecule, and recognizing this pattern prevents you from mistaking one charge state for a different molecular weight.
Step 2: Find the Molecular Ion to Confirm Molecular Weight
The molecular ion is the peak that corresponds to the intact, unfragmented molecule, and its m/z value directly reflects the molecular weight. In electron ionization, this is usually the peak at the highest m/z value in the spectrum, assuming the molecule survives ionization intact. For peptides analyzed by ESI, you must deconvolute the charge state series to calculate the neutral molecular mass.
To confirm molecular weight, take the m/z value of the molecular ion and account for the charge. For a single charge, the nominal mass equals the m/z value minus the mass of the added proton. Software tools perform this deconvolution automatically, but understanding the principle lets you sanity-check the output.
Step 3: Read Fragmentation Patterns to Verify Your Peptide Sequence
Fragmentation patterns are the key to peptide sequence verification, since the mass difference between fragment ions reveals which amino acid was lost. In tandem mass spectrometry (MS/MS), a precursor ion is isolated and fragmented, producing a series of b-ions and y-ions that correspond to cleavage along the peptide backbone. The mass gap between consecutive ions in the same series matches the residue mass of a specific amino acid (peer-reviewed research).
Here is the practical logic for reading a spectrum to confirm a sequence, using a hypothetical peptide with the sequence A-P-G-R as an example.
- Identify the Series: Start by looking for pairs of peaks that share a complementary relationship. For a peptide of mass M, a b-ion and a y-ion from the same cleavage will often have m/z values that sum to M + 1 (for a singly charged precursor) or M/2 + 1 (for a doubly charged precursor). This helps you distinguish b-ions from y-ions.
- Start from the Low-Mass End: The lowest-mass fragment ions are typically the most informative. The smallest b-ion (b1) corresponds to the first N-terminal amino acid (in our example, Alanine, residue mass 71 Da). The smallest y-ion (y1) corresponds to the C-terminal amino acid (Arginine, residue mass 156 Da, plus water and a proton).
- Walk the Ladder: Look for the next peak in the series. The difference between b1 (Alanine, 71 Da) and b2 (Alanine-Proline, 168 Da) is 97 Da, which is the residue mass of Proline. The difference between y1 (Arginine, 175 Da) and y2 (Glycine-Arginine, 232 Da) is 57 Da, which is the residue mass of Glycine. By walking this ladder, you can read the sequence from both ends.
- Confirm with the Full Set: The most confident assignment comes when you can match a continuous series of b-ions (b1, b2, b3...) and a continuous series of y-ions (y1, y2, y3...) to the expected sequence. A single matching peak is not enough; you need the pattern to be self-consistent.
| Fragment Series | Location | Mass Calculation | Purpose |
|---|---|---|---|
| b-ion | N-terminus | Sum of residue masses + proton | Sequence from N-terminus |
| y-ion | C-terminus | Sum of residue masses + water + proton | Sequence from C-terminus |
| a-ion | N-terminus | b-ion minus CO (28 Da) | Confirms b-ion assignment |
| Neutral loss | Any | Parent ion minus small molecule (e.g., H2O, NH3) | Detects modifications like water loss or deamidation |
A mismatch at any position in the ladder indicates a sequence error, a deletion, or an unexpected modification. For example, a mass shift of +16 Da on a specific fragment ion could indicate an oxidation of a Methionine residue, while a shift of -17 Da might suggest N-terminal pyroglutamation. These are common artifacts in peptide synthesis and storage, and recognizing them from the fragmentation pattern is a critical skill for verifying the integrity of your research compound.
If you are working with a complex mixture, you will often need to use a data-dependent acquisition method where the instrument automatically selects the most abundant precursor ions for fragmentation. In this case, you will have a list of MS/MS spectra, each corresponding to a different peptide. The same logic of walking the b- and y-ion ladders applies to each individual spectrum.
Step 4: How to Read LC-MS Data for Purity and Impurities
Learning how to read LC-MS data adds a chromatographic dimension, where the x-axis becomes retention time and the y-axis is total ion current. Each peak in the chromatogram represents a compound eluting from the column, and the area under each peak is proportional to its abundance. A pure peptide should produce a single dominant peak, with any additional peaks indicating impurities.
To assess purity, integrate the area of the main peak and divide it by the total area of all peaks. This calculation yields the chromatographic purity percentage, which reputable suppliers report as their HPLC purity. In practice, values of ≥99% indicate a highly pure product, but you should still inspect the spectrum for co-eluting impurities that may hide under the main peak (peer-reviewed research).
The Critical Next Step: Reading the Mass Spectrum of Each Peak
The most common mistake beginners make is stopping at the chromatogram. The real power of LC-MS lies in extracting the mass spectrum for each chromatographic peak. This is where you confirm the identity of the main component and identify the nature of any impurities.
- Extract the Spectrum: In your data analysis software (e.g., Thermo Xcalibur, Agilent MassHunter, or open-source tools like OpenMS), you can extract an average mass spectrum across the width of a specific chromatographic peak. This gives you the m/z values of all ions that eluted at that retention time.
- Confirm the Main Peak: For your main peak, you should see a charge state envelope corresponding to your target peptide. Deconvolute this envelope to get the neutral molecular mass. This measured mass should match the theoretical mass from your Certificate of Analysis within the instrument's mass accuracy specification (typically < 5 ppm for modern high-resolution instruments like an Orbitrap or Q-TOF).
- Identify the Impurity Peaks: For any smaller chromatographic peak, extract its mass spectrum and determine its molecular mass. A common impurity in synthetic peptides is a deletion sequence (e.g., missing one amino acid), which will have a mass that is lower by the residue mass of the missing amino acid. Another common impurity is a truncated sequence from incomplete coupling during synthesis. By knowing the theoretical mass of your target and common failure modes, you can often assign a putative identity to the impurity.
- Check for Co-elution: If you see a shoulder on your main peak, extract the mass spectrum from the leading and trailing edges of that shoulder separately. If the spectra differ, you have a co-eluting impurity that is hidden under your main peak. This is a critical check that simple area integration will miss.
Modern Tools for Visualizing and Analyzing LC-MS Data
While vendor software is powerful, it is often proprietary and can be limiting for custom analysis. A unique and practical approach is to use open-source tools for a deeper dive into your data.
- Python with libraries like
pyOpenMSandmatchms: These libraries allow you to programmatically read raw LC-MS data files (e.g.,.mzMLformat), perform peak picking, and even calculate the theoretical m/z of your peptide and its fragments for comparison. This is invaluable for automating the verification of multiple batches. - R with the
xcmspackage: This is a workhorse in the metabolomics community for processing, filtering, and visualizing LC-MS data. It excels at aligning peaks across multiple samples, which is useful for comparing your batch against a reference standard.
By moving beyond the single purity percentage and actively interrogating the mass spectra of all chromatographic peaks, you transform your LC-MS data from a simple QC pass/fail into a powerful diagnostic tool for understanding the true composition of your research compound.
What to Check on a Mass Spectrometry Certificate of Analysis
A mass spectrometry certificate of analysis is the formal document that ties your batch to its quality data, and you should verify several fields before use. First, confirm the lot number on the certificate matches the lot number printed on the vial. Second, check the expected molecular weight against the measured mass, and the difference should fall within the instrument's mass accuracy specification.
The certificate should also list the HPLC purity percentage, the method used, and the date of analysis. Look for the ionization technique, whether electron ionization or electrospray ionization, and the mass spectrometer model. If the certificate lacks any of these details, or if the measured mass does not match the theoretical value, contact the supplier before proceeding with your research.
Common Pitfalls and Troubleshooting Artifacts
Several artifacts can derail your interpretation of mass spectrometry data, and knowing them saves hours of confusion. Adducts, such as sodium or ammonium adducts, produce peaks at higher m/z values than the expected molecular ion, and they are common in ESI. Solvent clusters and background ions from the mobile phase can also appear as false peaks, so always compare your sample spectrum against a blank run.
A practical troubleshooting approach is to follow a decision tree: check the base peak, then look for the molecular ion, then examine fragmentation. If the molecular ion is missing, consider that your ionization source may not be suitable or that the compound fragmented in-source. If the spectrum is noisy, apply background subtraction to clean up the signal and improve the signal-to-noise ratio.
Conclusion
Reading mass spectrometry data becomes manageable when you follow a consistent sequence: start with the m/z axis and base peak, locate the molecular ion, interpret fragmentation for sequence confirmation, and then evaluate the chromatogram for purity. This structured approach to mass spectrometry data protects your research from compromised materials and flawed conclusions. At Globo Research Peptides, every batch ships with a full Certificate of Analysis documenting verified ≥99% HPLC purity and rigorous third-party testing, so you can confirm your peptide sequence accuracy before your study begins. Get started with Globo Research Peptides and ORDER NOW.
=== FAQ ANSWERS (ARTICLE CONTENT, AUDIT EACH ONE SEPARATELY, SAME RULES) ===
[1] Q: How do I interpret mass spectrometry results for research peptides? A: Start by looking at the x-axis for the mass-to-charge ratio (m/z) and the y-axis for relative abundance. The tallest peak is the base peak, set to 100 percent. For a purified peptide, you should see a major peak corresponding to the expected molecular weight, often with a charge state that matches the ionization method. Then examine the certificate of analysis for the expected molecular weight and compare it to the observed m/z value. A difference under 5 ppm indicates high mass accuracy.
[2] Q: What does a base peak of 43 mean? A: A base peak at m/z 43 is not the molecular ion for a peptide. It is a common fragment ion, often representing the acylium ion (C2H3O+) or a hydrocarbon fragment. In electron ionization this is frequently seen, but in ESI-MS for peptides it suggests significant fragmentation or a contaminant. If your spectrum's base peak is at m/z 43, the ionization source conditions may be too harsh, or the sample may contain a solvent or plasticizer impurity. Check the full spectrum for the intact molecular ion.
[3] Q: What is the difference between LC-MS and MALDI-TOF data interpretation? A: LC-MS (liquid chromatography-mass spectrometry) separates compounds by retention time before detection, producing a chromatogram and multiple spectra. It usually creates multiply charged ions, so the m/z value is the molecular weight divided by the charge. MALDI-TOF typically generates singly charged ions, making the m/z value directly equal to the molecular weight plus a proton. For peptide verification, LC-MS gives you purity information from the chromatogram, while MALDI-TOF provides a quick mass confirmation.
[4] Q: How do I spot impurities in mass spectrometry data? A: Look for extra peaks that do not match the expected peptide mass or its typical fragments. In LC-MS, check the chromatogram for multiple peaks; each peak indicates a separate compound. Compare the relative abundance of these peaks to the main product peak. Peaks above 1 percent abundance may indicate impurities. Also watch for adducts like sodium (+22 Da) or potassium (+38 Da) which are common but not impurities. A clean certificate of analysis should show the main peak at over 99 percent purity.
Frequently Asked Questions
How do I interpret mass spectrometry results for research peptides?
Start by looking at the x-axis for the mass-to-charge ratio (m/z) and the y-axis for relative abundance. The tallest peak is the base peak, set to 100 percent. For a purified peptide, you should see a major peak corresponding to the expected molecular weight, often with a charge state that matches the ionization method. Then examine the certificate of analysis for the expected molecular weight and compare it to the observed m/z value. A difference under 5 ppm indicates high mass accuracy.
What does a base peak of 43 mean?
A base peak at m/z 43 is not the molecular ion for a peptide. It is a common fragment ion, often representing the acylium ion (C2H3O+) or a hydrocarbon fragment. In electron ionization this is frequently seen, but in ESI-MS for peptides it suggests significant fragmentation or a contaminant. If your spectrum's base peak is at m/z 43, the ionization source conditions may be too harsh, or the sample may contain a solvent or plasticizer impurity. Check the full spectrum for the intact molecular ion.
What is the difference between LC-MS and MALDI-TOF data interpretation?
LC-MS (liquid chromatography-mass spectrometry) separates compounds by retention time before detection, producing a chromatogram and multiple spectra. It usually creates multiply charged ions, so the m/z value is the molecular weight divided by the charge. MALDI-TOF typically generates singly charged ions, making the m/z value directly equal to the molecular weight plus a proton. For peptide verification, LC-MS gives you purity information from the chromatogram, while MALDI-TOF provides a quick mass confirmation.
How do I spot impurities in mass spectrometry data?
Look for extra peaks that do not match the expected peptide mass or its typical fragments. In LC-MS, check the chromatogram for multiple peaks; each peak indicates a separate compound. Compare the relative abundance of these peaks to the main product peak. Peaks above 1 percent abundance may indicate impurities. Also watch for adducts like sodium (+22 Da) or potassium (+38 Da) which are common but not impurities. A clean certificate of analysis should show the main peak at over 99 percent purity.
Frequently Asked Questions
Q: How do I interpret mass spectrometry results for research peptides?
A: Start by looking at the x-axis for the mass-to-charge ratio (m/z) and the y-axis for relative abundance. The tallest peak is the base peak, set to 100 percent. For a purified peptide, you should see a major peak corresponding to the expected molecular weight, often with a charge state that matches the ionization method. Then examine the certificate of analysis for the expected molecular weight and compare it to the observed m/z value. A difference under 5 ppm indicates high mass accuracy.
Q: What does a base peak of 43 mean?
A: A base peak at m/z 43 is not the molecular ion for a peptide. It is a common fragment ion, often representing the acylium ion (C2H3O+) or a hydrocarbon fragment. In electron ionization this is frequently seen, but in ESI-MS for peptides it suggests significant fragmentation or a contaminant. If your spectrum's base peak is at m/z 43, the ionization source conditions may be too harsh, or the sample may contain a solvent or plasticizer impurity. Check the full spectrum for the intact molecular ion.
Q: What is the difference between LC-MS and MALDI-TOF data interpretation?
A: LC-MS (liquid chromatography-mass spectrometry) separates compounds by retention time before detection, producing a chromatogram and multiple spectra. It usually creates multiply charged ions, so the m/z value is the molecular weight divided by the charge. MALDI-TOF typically generates singly charged ions, making the m/z value directly equal to the molecular weight plus a proton. For peptide verification, LC-MS gives you purity information from the chromatogram, while MALDI-TOF provides a quick mass confirmation.
Q: How do I spot impurities in mass spectrometry data?
A: Look for extra peaks that do not match the expected peptide mass or its typical fragments. In LC-MS, check the chromatogram for multiple peaks; each peak indicates a separate compound. Compare the relative abundance of these peaks to the main product peak. Peaks above 1 percent abundance may indicate impurities. Also watch for adducts like sodium (+22 Da) or potassium (+38 Da) which are common but not impurities. A clean certificate of analysis should show the main peak at over 99 percent purity.